Prometheus: Quick Introduction
Prometheus
Prometheus is an open-source systems monitoring and alerting application.
Prometheus collects and stores its metrics as time series data, i.e. metrics information is stored with the timestamp at which it was recorded, alongside optional key-value pairs called labels.
Why?
Prometheus allows us to collect metrics from different sources. We can leverage this data to understand why our application behaves how it behaves.
What Is A Metric?
A metric is an important characteristic of a system. We measure a metric to gain insights into the system. Useful metrics depend on the application at hand. For a web server the metrics of interest could be the request times etc.
To measure the right metric for your application, collect all data that can help you debug your app in case an issue occurs.
There are different kind of metric types (models) in Prometheus, which will be introduced below.
Metric Labels
Prometheus’s enables multi dimensional data by using labels. A metric name together with key value pairs of labels identifies a metric - for example: all HTTP requests that used the method POST to the /api/tracks handler. The query language allows filtering and aggregation based on these dimensions.
You can take advantage of labels to create a single metric with different use cases. For example, when you have multiple metrics that you want to add/average/sum, then you can use a single metric with labels rather than multiple metrics.
For example, rather than http_responses_500_total and http_responses_403_total, create a single metric called http_responses_total with a code label for the HTTP response code. You can then process the entire metric as one in rules and graphs.
Basic Architecture
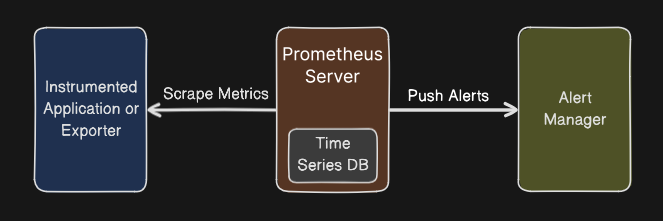
The most important building blocks of Prometheus are:
- Prometheus Server: Scrapes and stores the metrics data
- Targets: Are scraped to pull data, for example an instrumented application that exposes its metrics
- Alertmanager: Raises alerts based on preset rules
Features
A sub-set of features:
- Stores all data as time series: Streams of timestamped values belonging to the same metric and the same set of labeled dimensions
- Dimensional data: Time series are identified by a metric name and a set of key-value pairs
- Query language PromQL: Allows to query the metrics and apply built-in functions
- Metrics Import & Export: Integration with wide variety of external systems
- Visualisation: Enables to view the metrics as diagram in a Web-UI. Integrates well with Grafana
- Alerting: Define rules and notification channels like email
Metric Types
Counter
A counter is a cumulative metric that represents a single monotonically increasing counter whose value can only increase or be reset to zero on restart. For example, you can use a counter to represent the number of requests served, tasks completed, or errors.
Do not use a counter to expose a value that can decrease. For example, do not use a counter for the number of currently running processes; instead use a gauge.
Gauge
A gauge is a metric that represents a single numerical value that can arbitrarily go up and down.
Gauges are typically used for measured values like temperatures or current memory usage, but also counts that can go up and down, like the number of concurrent requests.
Histogram
A histogram samples observations (usually things like request durations or response sizes) and counts them in configurable buckets. It also provides a sum of all observed values.
Demo
We’ll create a small Java client below.
Client Application
The source code is available on GitHub.
package com.tklk;

import io.prometheus.metrics.core.metrics.Gauge;
import io.prometheus.metrics.exporter.httpserver.HTTPServer;
import io.prometheus.metrics.model.snapshots.Unit;
import java.io.IOException;
import java.util.Random;
import java.util.concurrent.Executors;
import java.util.concurrent.ScheduledExecutorService;
import java.util.concurrent.TimeUnit;

public class Main {

  public static void main(String[] args) throws InterruptedException, IOException {
    Gauge temperature = Gauge.builder()
        .name("home_temperature_in_celsius")
        .help("current temperature at home")
        .labelNames("location")
        .unit(Unit.CELSIUS)
        .register();

    // Not really needing a label for this simple example as we've a fixed location
    var location = "Home";

    // Define the label and set a starting value
    temperature.labelValues(location).set(15.0);

    Runnable temperatureCalculator = () -> {
      var random = new Random();
      var temp = random.nextDouble(-10.0, 30.1);
      temperature.labelValues(location).set(temp);
    };

    // Calculate the temperature periodically
    ScheduledExecutorService executor = Executors.newSingleThreadScheduledExecutor();
    executor.scheduleAtFixedRate(temperatureCalculator, 0, 5, TimeUnit.SECONDS);

    HTTPServer server = HTTPServer.builder()
        .port(9400)
        .buildAndStart();

    System.out.println(
        "HTTPServer listening on port http://localhost:" + server.getPort() + "/metrics");

    Thread.currentThread().join(); // sleep forever
  }

}
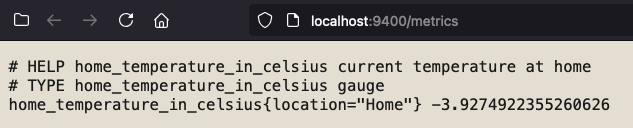
Please open the URL http://localhost:9400/metrics in your browser and see the metrics:
Prometheus Server
Our client collects the metrics, but they are not available in Prometheus yet. To allow the Prometheus server to scrape our metrics, we need to install and run it first.
Download the latest Prometheus server release, and append the following snippet to the configuration file prometheus.yml:
scrape_configs:
  - job_name: "prometheus-java-client-demo"
    static_configs:

      - targets: ["localhost:9400"]
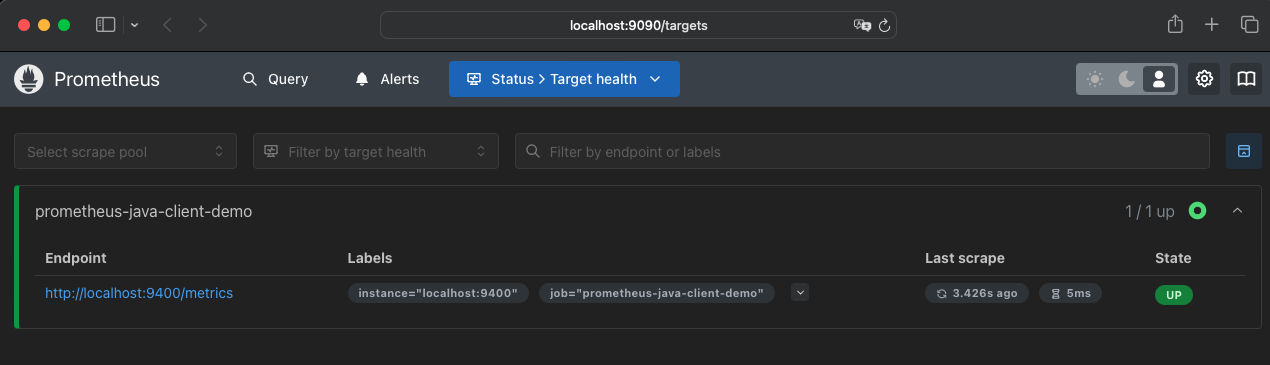
Run Prometheus and open the URL http://localhost:9090/targets in your browser. You should see your java client listed:
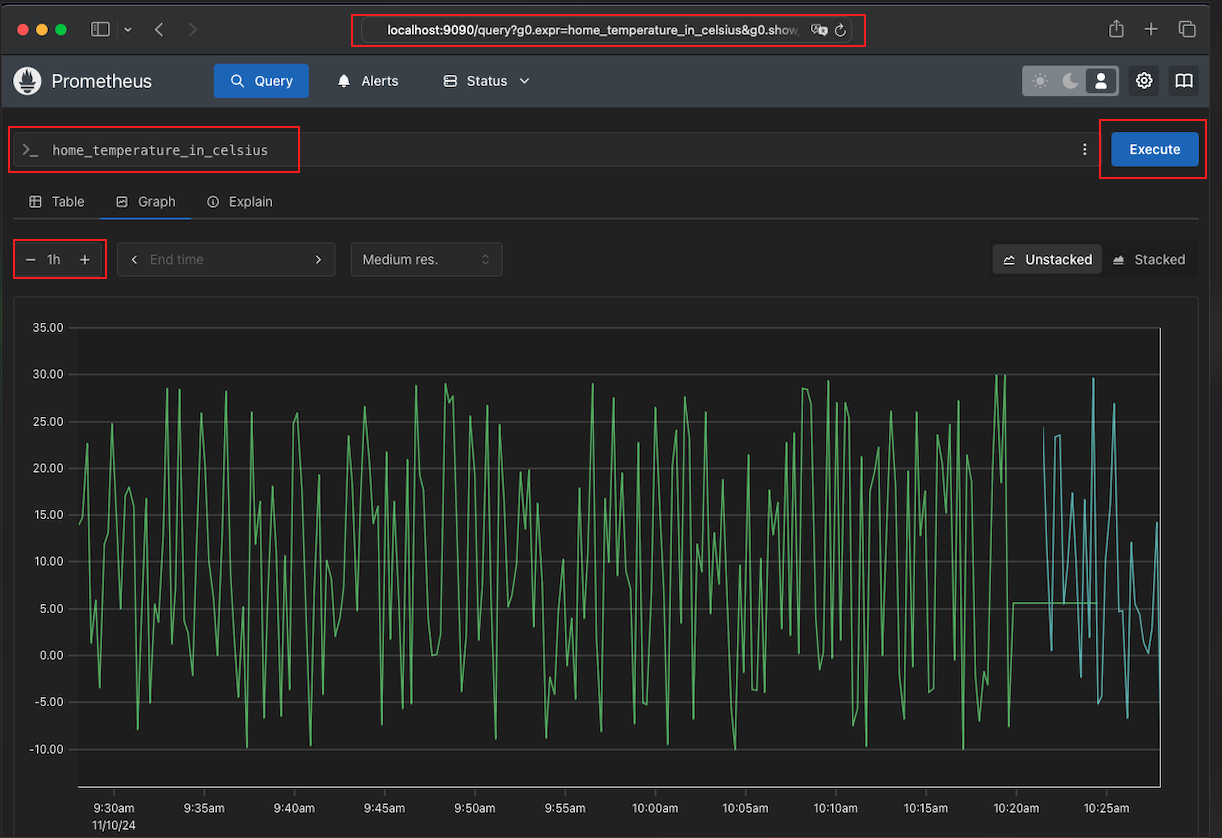
Visualize your metrics by visiting the page http://localhost:9090/query and entering your metric name home_temperature_in_celsius into the input field on top of the page. Click the button Execute. Select the Graph tab and adjust the time period above the chart:
Summary
We did talk about Prometheus briefly. We implemented a simple Java client to collect metrics and provide it to Prometheus. You should have a basic understanding of Prometheus now.
In the coming post we’ll talk about Grafana integration.